
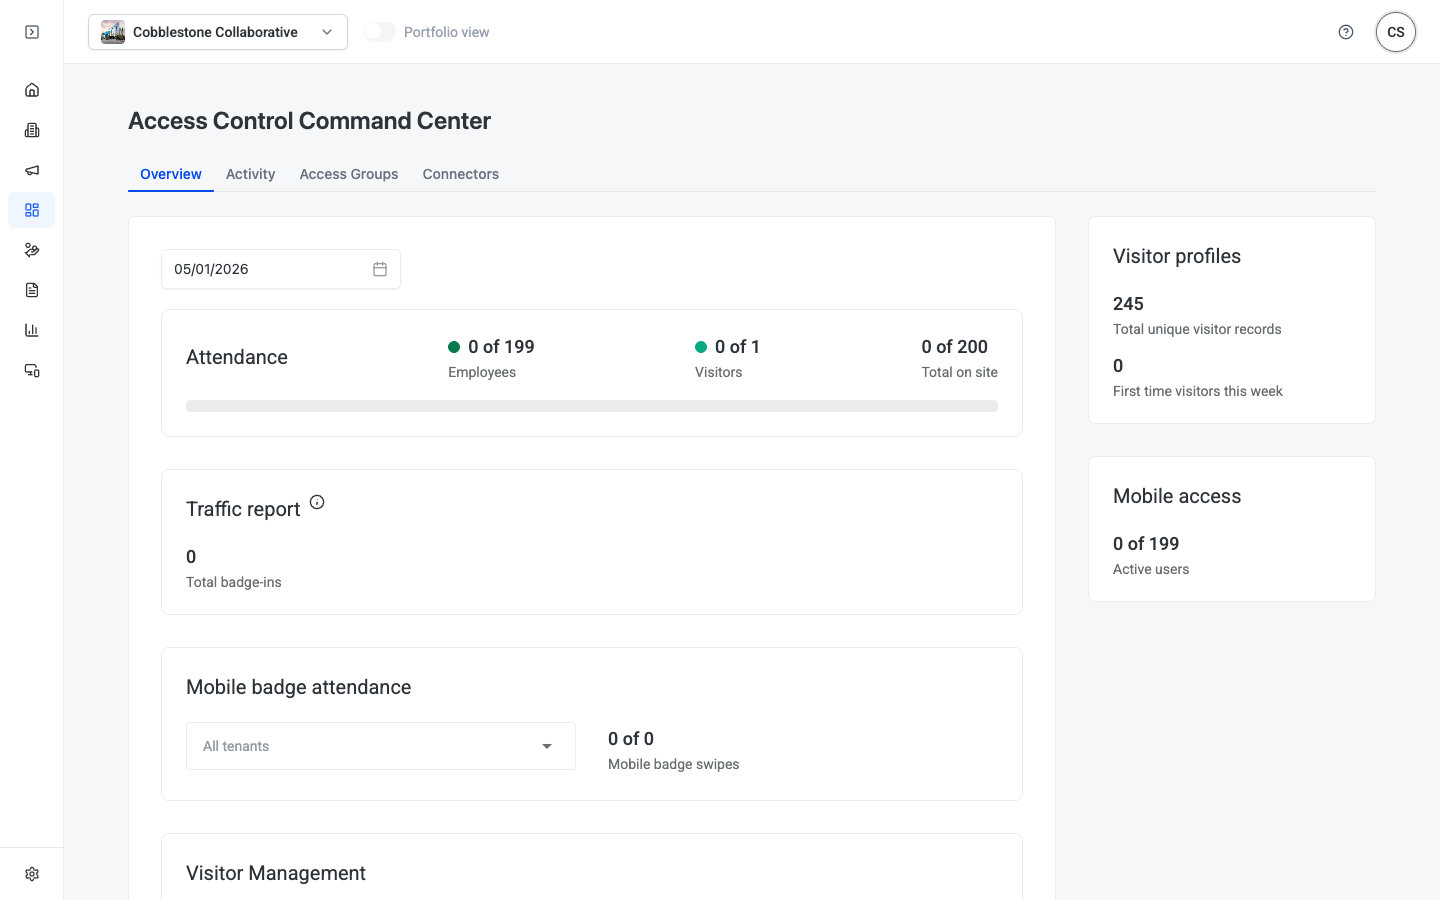
The Access Control Command Center connects HqO to your building's physical access hardware. Use it to monitor real-time attendance, review a chronological log of all entry events, map tenants to access groups, and check the status of your hardware connectors — all from a single view.
Overview
Navigate to HqO Admin > Operations > Access Control to open the Command Center. The page defaults to the Overview tab and displays data for today's date.
🔒 Permission required: Access Control is visible to administrators with Operations permissions. Contact your HqO account team if you don't see this section in the sidebar.
Before live data appears, your access control hardware must be connected via a Connector integration. Contact your HqO implementation team to configure the initial hardware connection.
Tabs
The Command Center is organized into four tabs:
| Tab | What it shows |
|---|---|
| Overview | Real-time attendance summary for a selected date, total badge-ins, mobile badge swipes by tenant, and visitor management metrics |
| Activity | Chronological log of all access events — filterable by access point, company, and action type |
| Access Groups | Tenant-to-access-group mapping that controls which tenants can reach which doors or areas |
| Connectors | Status table for all hardware connector integrations, including failure counts and last-seen timestamps |
Overview tab
The Overview tab surfaces four panels for a selected date (use the date picker to change the day):
Attendance
Shows the current occupancy against building capacity, broken down by:
| Metric | Description |
|---|---|
| Employees | Employees currently on-site vs. registered employee count |
| Visitors | Visitors currently on-site vs. expected visitors for the day |
| Total on site | Combined total of employees and visitors vs. building capacity |
A capacity bar below the numbers provides a visual percentage of occupancy.
Traffic report
Displays the Total badge-ins for the selected date — the count of all door-swipe events recorded by connected hardware.
Mobile badge attendance
Shows mobile credential usage by tenant for the selected date:
- Use the All tenants dropdown to filter by a specific company.
- The Mobile badge swipes count shows how many times mobile credentials were used by users in that tenant.
Right-side panels
| Panel | Metric |
|---|---|
| Visitor profiles | Total unique visitor records in the system; first-time visitors this week |
| Mobile access | Active mobile-credential users vs. total registered users |
Activity tab
The Activity tab shows a filterable log of every access event recorded by connected hardware.
Filters
| Filter | Options |
|---|---|
| Access point | Filter by a specific door reader or entry point |
| Company | Filter by tenant company |
| Action | Filter by event type: Access granted or Access denied |
Activity log columns
| Column | Description |
|---|---|
| Date / Time | Timestamp of the access event |
| Action | Access granted or Access denied |
| Access point | The door reader or entry point where the event occurred |
| Company | The tenant company the user belongs to |
| Name | The user who badged in (click to open their user record) |
| Host | The host associated with the visit, if applicable |
Access Groups tab
The Access Groups tab lets you map tenants to your hardware's access control groups. When a tenant is mapped to a group, all users in that tenant receive the access permissions defined for that group in your hardware system.
Tenant ↔ Access Group Mapping
Each mapping row consists of:
- Tenant — select a tenant company from the dropdown.
- → (arrow) — indicates the direction of the mapping.
- Access Groups — select one or more access groups from your hardware system to grant to that tenant's users.
Click + Add additional mapping to create additional tenant-to-group mappings. You can map multiple tenants to different groups, or multiple groups to the same tenant.
💡 Tip: Access groups are defined and managed in your access control hardware system (e.g., Lenel, Brivo). HqO surfaces those groups here for mapping — you cannot create new hardware groups from this tab.
Connectors tab
The Connectors tab shows the status of all hardware integrations connected to this building.
Filters
| Filter | Options |
|---|---|
| Status | Filter by connector status: Online or Offline |
| Connector type | Filter by the hardware provider (e.g., Lenel NetBox, Brivo, Avigilon Alta) |
Connector table columns
| Column | Description |
|---|---|
| Connector type | The hardware provider or integration type |
| Building | The building this connector is associated with |
| Status | Online (green) — connector is active and communicating; Offline (red) — connector is not responding |
| Failure count | Number of consecutive communication failures recorded |
| Last online | Timestamp of the most recent successful connection |
| First offline | Timestamp when the connector first went offline (if applicable) |
| Last offline | Timestamp of the most recent offline event (if applicable) |
A history icon (🕐) next to the status indicator opens a connection history log for that connector.
Core workflows
View today's attendance
- Go to
HqO Admin > Operations > Access Control. - The Overview tab loads by default, showing today's date.
- Use the date picker to view attendance for a different day.
- Use the All tenants dropdown in the Mobile badge attendance panel to filter by a specific company.
Review entry activity
- Click the Activity tab.
- Use the Access point, Company, and Action dropdowns to filter the log.
- Each row shows the user, action, access point, and timestamp.
- Click a user's name to open their user record.
Map a tenant to an access group
- Click the Access Groups tab.
- In the Tenant ↔ Access Group Mapping section, select a tenant from the Tenant dropdown.
- Select one or more access groups from the Access Groups dropdown.
- To add more mappings, click + Add additional mapping and repeat.
- Save your changes.
Check connector status
- Click the Connectors tab.
- Review the Status column — Online means the connector is active and reporting data.
- If a connector shows Offline, check the Failure count and First offline timestamp to assess the issue.
- Contact your HqO implementation team or hardware vendor if a connector remains offline.
FAQ
Why does my attendance count show zero? The building's access control connector may not be active, or today's date may not have any badge-in data yet. Check the Connectors tab to confirm your integration is Online. If the connector is online but attendance is still zero, verify that your hardware is actively sending events to HqO.
Can I restrict access for a specific tenant only? Yes. On the Access Groups tab, map only that tenant to the access groups covering the doors you want to restrict. Other tenants not mapped to those groups will not receive that access.
Does Access Control work with mobile credentials? Yes. Users with the HqO mobile app can use their phone as a badge if your hardware supports mobile credentials and the feature is enabled for your property. The Mobile badge attendance panel and Mobile access card on the Overview tab track this usage.
Where do access groups come from? Access groups are defined in your physical access control hardware system (such as Lenel NetBox or Brivo). HqO imports them automatically once a Connector is configured. You cannot create or edit groups in HqO — manage them in your hardware platform.
What's the difference between the Traffic report and Attendance? Traffic report counts total badge-in events for the day (including re-entries). Attendance shows unique people currently on-site vs. building capacity at the time of viewing.
Need help?
Contact your HqO account team or email appsupport@hqo.co.